Tutorial
BeginnerCheck Who Answered Your Member Survey Against Who You Invited, Group by Group
Choose a CSV list of invited members in a browser lab, set your own gaps, and read which groups answered less or more than their share of the invited list, plus small groups and blank or repeated values.
Time needed: About 40 minutes, plus the time to compare each listed item with the original export
Before you start:
- The send log of a closed member survey, with a member id and whether each invited member answered, or use the sample files
- Your member list, with a few group columns such as member type, region and years of membership as bands
- A recent desktop browser
Surveys Member Research Data Quality Csv
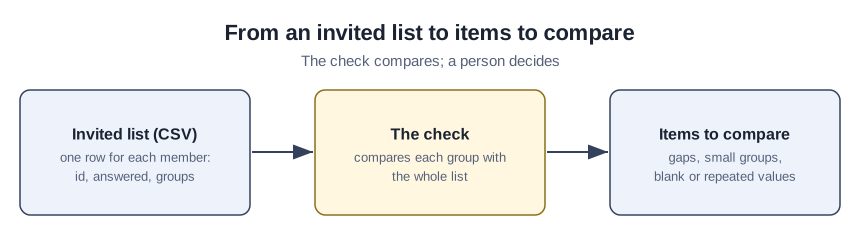
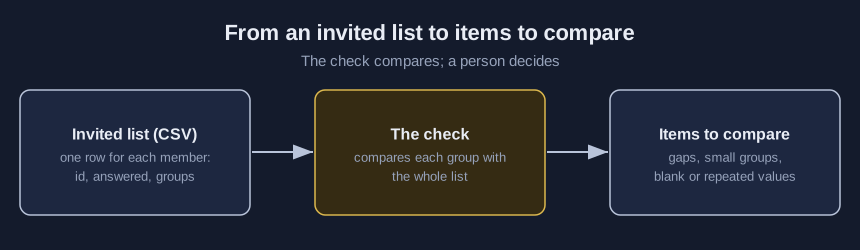
A survey report says what members think, yet the answers may come mostly from some kinds of members. By the end you will have compared the members who answered with the members invited, group by group, and recorded what you found. For careless or repeated responses inside an export, see the survey response screen tutorial; the article on open survey links covers fake responses to open survey links.
Try it now: the who answered check compares a CSV list of invited members with who answered, inside your browser tab. Nothing is uploaded, and it shows member ids and group values and no other column. Until your organization decides who may see the real member list, use made-up data, and do not call the results anonymous, because a small group can point to the people in it.
What federal guidance and two studies compare, and what they leave open
No source studied an online or email survey of association members, none gives a cutoff for a gap or a smallest group, and none shows that running this check improves a decision.
A federal standard for federal surveys, September 2006, names comparing respondents with nonrespondents across subgroups using sample frame variables. Federal interagency guidance, June 2023, says subgroup response rates can help identify potential sources of nonresponse bias, and that a gap against a benchmark does not by itself show it. Federal agency internal guidance, revised September 2009, copy hosted on ignet.gov, says differing response rates across subgroups may indicate bias, and that a finding of no bias means none was detected by the methods used.
Fifty mailed surveys of pediatricians run by a medical association, 1994 to 2002, had response rates of 52 to 81 percent, averaging 68 percent. The authors found average response bias fairly small on every factor tested, and say that does not rule out larger bias on topic questions.
A university study of a national telephone survey found 24 ratios of survey estimates of club sport participation to registration counts running from 1.72 to 7.80. Its authors conjecture non-response bias and caution against generalising beyond four club sports in one state.
Compare who answered with who was invited in twelve steps
The kit in steps 2, 10 and 11 arrives when the lab page’s form receives an address.
- Export the send log with one row for each invited member and whether each answered.
- Start your file from the first row of the kit’s members-blank-template.csv.
- Join the group columns from your member list, with years of membership as bands.
- Replace the starting names and words under “Columns in your file” with your own.
- Replace the three numbers under “Settings you can change” with your own.
- Pick the invited list with “CSV file from your computer”.
- Look at the status line for rows read, invited counted and answered.
- Scan the “Groups” table for the groups marked in its notes column.
- Compare each row under “Items to compare” with the original export.
- Write what you compared and decided in the kit’s compare-log.csv.
- Fill the lines of the kit’s how-to-say-it.txt when you report the survey.
- Feed the repaired list back through steps 6 to 9.
Reading the made-up groups
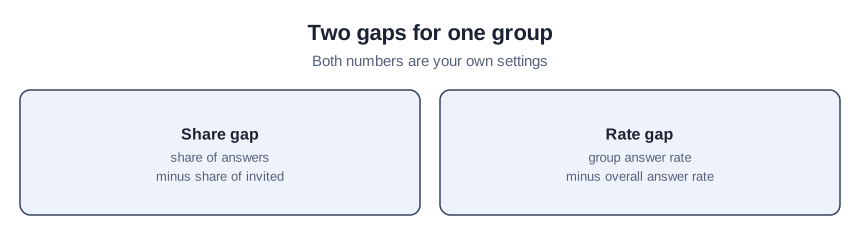
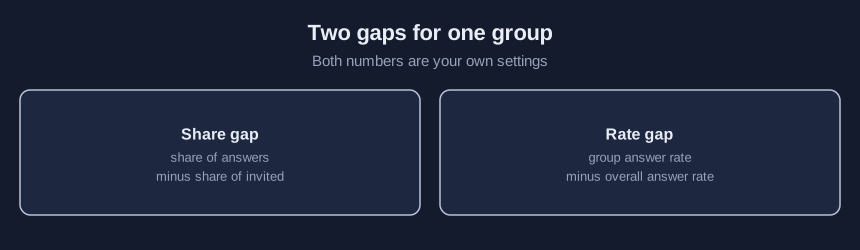
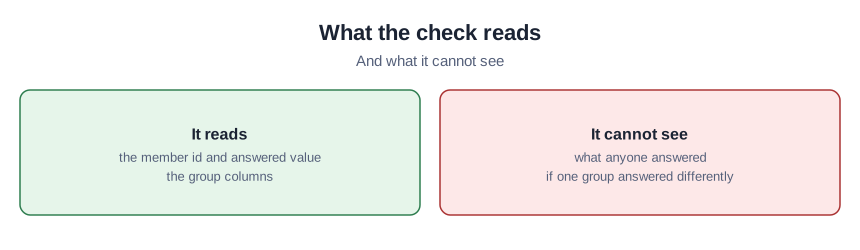
The rows here are made up for teaching. Press “Use the made-up sample with problems planted” and leave the settings alone. The Student group is 15.1 percent of the invited list and 5.0 percent of the answers, so its share gap is 10.1 points under; with 4 of 30 invited answering, its answer rate is 26.9 points below the overall rate. The “10 or more” years group has the opposite gap. Row 22 holds the answered value “maybe”, row 202 repeats a member id and row 203 has none. “North” and “north” appear as one group written two ways. Each item is a prompt to open the original export and count by hand, not a finding.
Running the list with no problems planted
Press “Use the made-up sample with no problems planted”. The status line ends with “items to compare: 0” and no rows appear under “Items to compare”. That shows only that no gap reached your settings, so open a few members in the original export and read their group values.
Mistakes that make a gap look bigger or smaller
Counting a member who left or whose email bounced as invited lowers a group’s answer rate, and only you know whether that member belongs in the list. A group column unrelated to your questions can show a gap that does not matter. Editing the exported list to clear an item hides the question; correct the source list and run it again. Reading a small group closely is risky both ways: the rate swings, and the rows may point to individuals.
Where the check stops
The lab reads one CSV file up to 5 MB, compares one group column at a time, and never weights anything; this post gives no advice on weighting either way. The defaults of 10, 15 and 10 are the lab’s own settings, and no source gives them. The trial used invented lists in a single desktop browser, and nothing real went through it.
Sources (5)
- U.S. Office of Management and Budget: Standards and Guidelines for Statistical Surveys (federal standard for federal surveys, September 2006)
- Federal Committee on Statistical Methodology, Nonresponse Bias Subcommittee: Best Practices for Nonresponse Bias Reporting, FCSM-23-01 (federal interagency guidance, June 2023)
- U.S. Government Accountability Office: Addressing Nonresponse and Nonresponse Bias Issues in Surveys (federal agency internal guidance, revised September 2009, copy hosted on ignet.gov)
- Cull, O'Connor, Sharp and Tang: Response Rates and Response Bias for 50 Surveys of Pediatricians (Health Services Research 40(1), February 2005; journal article by staff of a medical member association, covering 50 mailed surveys of pediatricians, 1994 to 2002)
- Harvey, Charity, Sawyer and Eime: Non-response bias in estimates of prevalence of club-based sport participation from an Australian national physical activity, recreation and sport survey (BMC Public Health 18:895, 18 July 2018; journal article by university researchers, covering a national telephone survey in Australia)