Tutorial
BeginnerRecheck Every Number in an AI Summary Against the Source Table
Take an AI-written summary of a data table, find every number in it, and sort each one as exact, rounded, calculated or not in the source, then check counts, units and footnotes before the summary is reused.
Time needed: About 10 minutes
Before you start:
- An AI-written summary of a table you plan to reuse
- The source table the summary was written from, with its footnotes
- A calculator or spreadsheet for redoing any totals or averages
AI Literacy Data Board Reporting Member Services
You have an AI summary of a salary table, and its numbers are about to go into a member email. By the end of this tutorial you will have traced every number in it to a cell, labeled each one exact, rounded, calculated or unsupported, and checked its counts and units.
Try it now: the summary number recheck lab holds a real federal table and an editable summary. Load a sample case and press the recheck button. The lab marks each number PASS, FIX or STOP, then checks counts and units. The summaries are invented text written for the lab, framed as a staff note for an invented Summit Events Society; none is output from an AI tool.
The table we use
The lab uses the five industries that employ the most meeting, convention and event planners in the Bureau of Labor Statistics occupational wage estimates for May 2023. Other Support Services leads with 8,720 planners. Business, Professional, Labor, Political, and Similar Organizations employs 8,030 at an annual mean wage of $66,620. The national estimate for the occupation is 122,130.
Sort the numbers
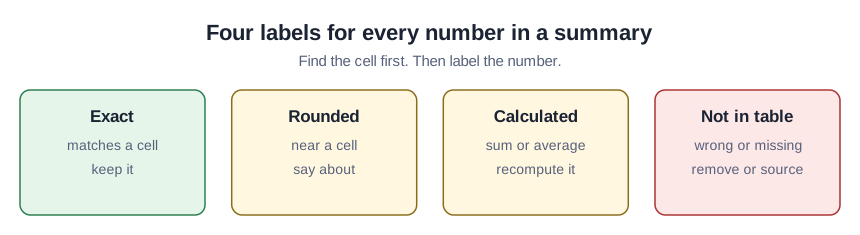
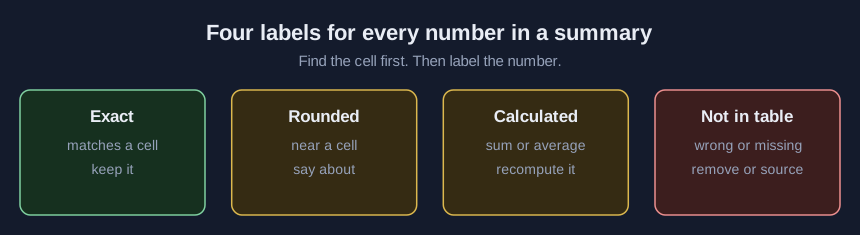
- List every number in the summary. Include counts written as words, such as “five industries.”
- Search the table for each one. A number that matches a cell exactly is done; note the row and column.
- Mark rounded numbers. If a number is a round version of a cell, decide whether rounding is acceptable, and if it is, write about in your copy.
- Recompute anything calculated. Totals, differences, averages and percent changes may not be in the table at all. Redo them from the source cells yourself and say how you got them.
- Look for near misses. A number with the same digits as a cell in a different order, or one digit changed, is wrong. Replace it with the cell.
- Remove anything you cannot trace. If a number is not in the table and not a simple calculation from it, take it out or find where it really came from.
- Check counts and units. Count the items the summary names against the number it states, and confirm hourly figures stay hourly, annual stay annual, and a share of one group is not described as a share of another.
- Copy the footnotes. The table says “Estimates do not include self-employed workers.” If the summary says “all planners,” that note goes with it.
The thresholds the lab uses for rounded (within 5% of a cell) and near miss (digits swapped or one digit different) are our teaching choices, not a statistical standard.
Worked example: the seeded summary
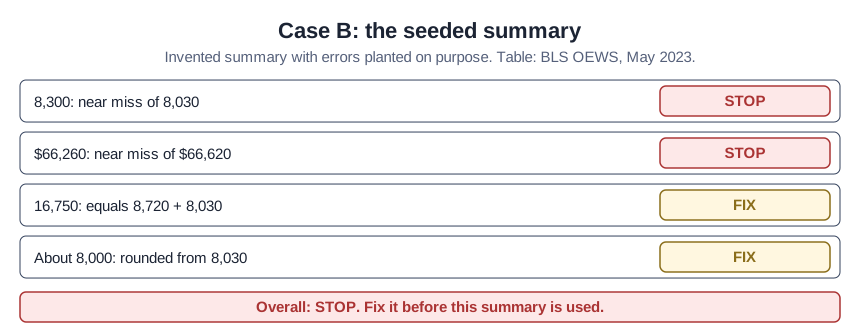
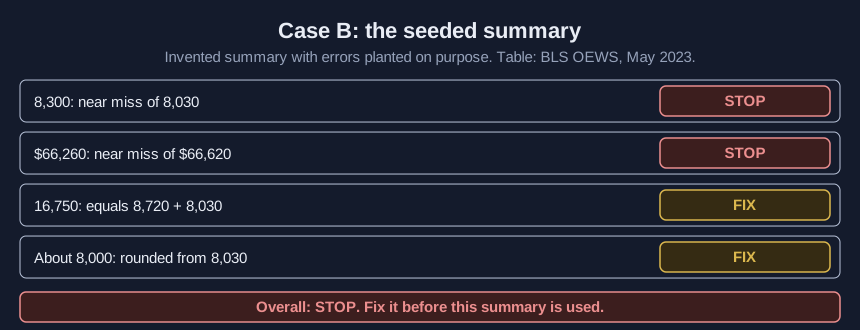
This is case B in the lab. The summary is invented, with errors planted on purpose:
“Business and professional organizations employed 8,300 planners at an average of $66,260 a year. Together with Other Support Services that is 16,750. About 8,000 work in colleges.”
| Number | Result | What the lab says |
|---|---|---|
| 8,300 | STOP | “8,300: not in the table. The closest value is 8,030 (Business, Professional, Labor, Political, and Similar Organizations, Employment); digits may have been swapped or changed. Correct it before use.” |
| $66,260 | STOP | “$66,260: not in the table. The closest value is $66,620 (Business, Professional, Labor, Political, and Similar Organizations, Annual mean wage); digits may have been swapped or changed. Correct it before use.” |
| 16,750 | FIX | “16,750: not in the table, but equals 8,720 + 8,030 (Other Support Services plus Business, Professional, Labor, Political, and Similar Organizations) = 16,750. The tool did arithmetic. Recompute it yourself and say how it was calculated.” |
| 8,000 | FIX | “8,000: looks like a rounded version of 8,030 (Business, Professional, Labor, Political, and Similar Organizations, Employment). Say “about” in your copy or use the exact figure.” |
The overall result is “STOP: At least one number is wrong or unsupported. Fix it before this summary is used.” The sum happens to be right here, but it is still the tool’s arithmetic, so it gets recomputed and labeled. The rounded figure also matched the wrong row: colleges employ 7,770.
Case C shows the unit trap. The summary says planners in traveler accommodation “earn $29.75 a year.” The lab returns “STOP: Unit check: $29.75 is an hourly figure in the table but the summary calls it annual.”
Check your result
- Every number in your copy points to a row and column, or to a calculation you redid and described.
- Every rounded figure says about.
- Counts match the items named.
- Hourly, annual and percentage figures keep the meaning the table gives them, and the footnotes travel with them.
Where a number recheck goes wrong
Checking only the numbers that look odd. The swapped digits in case B look as plausible as the correct ones.
Trusting a total because the parts are right. The table itself warns that “Estimates for detailed occupations do not sum to the totals because the totals include occupations not shown separately,” so adding rows will not reproduce the national figure.
Dropping the method note. Annual wages in this table were “calculated by multiplying the hourly mean wage by a ‘year-round, full-time’ hours figure of 2,080 hours.”