Article
BeginnerAn AI Tool Can Misread the Chart You Hand It
A fluent AI summary of a chart is a draft, not a reading of it, and an AI verdict on whether a chart misleads is not a design review. What to do instead.
AI Literacy Data Board Reporting Communications
The board packet closes on Friday, and someone on staff has a bar chart from an industry report that needs a two-sentence summary for the executive director’s memo. The quick route is to paste the image into an AI tool and ask what it shows, and the answer comes back polished enough to drop straight in. Before that becomes your association’s habit, look at what happened when researchers tested how well these tools read charts.
Reading the labels is not reading the comparison
Researchers at Princeton University, the University of Wisconsin, Madison and The University of Hong Kong built CharXiv, a set of 2,323 real charts handpicked from scientific papers across eight subjects. They asked two kinds of questions. Descriptive questions cover the basics, “such as the title, labels, and ticks.” Reasoning questions require “comparisons, approximations, and fine-grained analysis,” which is close to what a board memo asks of a chart. Answering either kind, the authors note, needs only what is visible in the chart, not specialist knowledge.
In the CharXiv benchmark, a 2024 test of 2024 models run on a validation set of 1,000 charts from scientific papers, the top-performing model answered 47.1% of the reasoning questions correctly, while in-house human participants answered 80.5%.
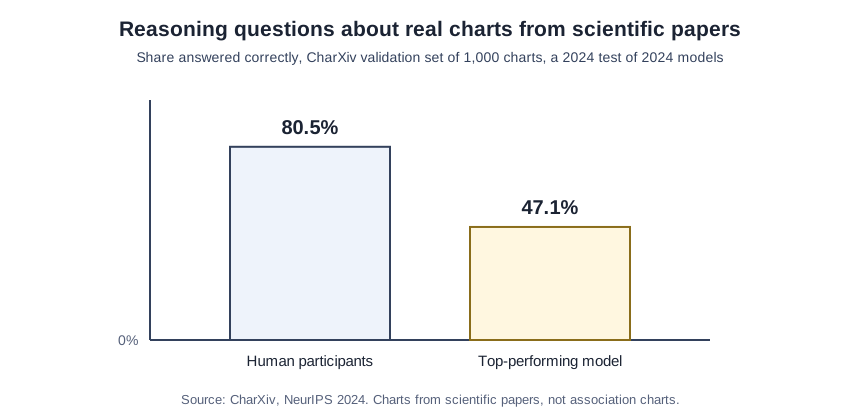
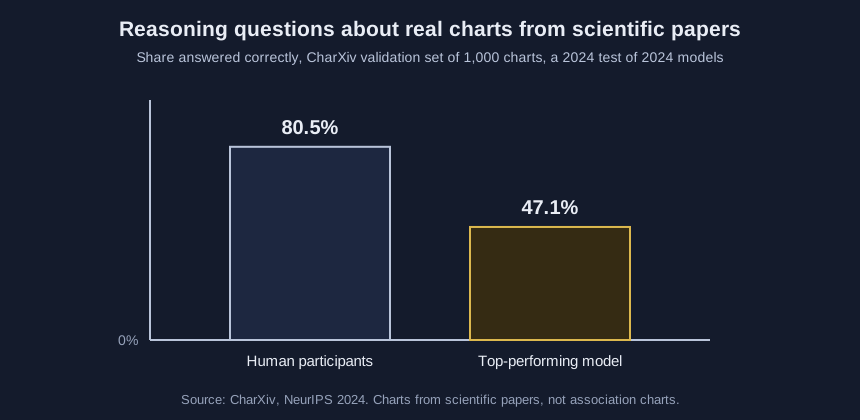
On the descriptive questions, the same paper reports that model reached 84.5%, against 92.1% for people. The authors tested 13 open-source and 11 proprietary models in all, and they made sure the human participants saw the exact same questions and were graded the same way. They are also candid about their own human figure, which they suggest could reflect “issues with automated grading or mistakes by participants in the human evaluation study.”
A tool can read the title and the tick marks well and still get the comparison wrong, and the comparison is usually the sentence that ends up in the memo. The authors also report that open-source models held up far worse than proprietary ones when a chart or the wording of a question changed slightly. These were charts from scientific papers, so the results say nothing direct about your industry report, but they do show that a confident summary of a chart has not earned trust on its own.
Asking the tool to judge the chart has its own problem
The second shortcut is to ask an AI tool, “Is this chart misleading?” before you reuse a chart from a sponsor or a partner. Lo and Qu at the Hong Kong University of Science and Technology tested four multimodal models on misleading charts gathered from search engines and social media, alongside a set of valid charts from news and government sources. Asked directly, most of the models labeled the charts “misleading,” and the best of them correctly identified only three of the 12 valid charts in the test set.
The verdicts were not useless: in the same study, the models picked up problems such as “3D effects, dual axes, and truncated axes.” They missed something more basic, though: “the absence of titles on charts did not seem to be flagged as a problem by any of the LLM responses.”
Wording changes the answer, not always for the better. With one later prompt in Lo and Qu’s experiments, one commercial assistant flagged major issues in 74 charts and called only one valid, in a test set of 63 misleading and 12 valid charts. The authors found that prompts which “did not include reasoning steps in the output, led to over-reporting issues.” The models answered most questions about chart type, titles and 3D effects correctly, but had “difficulties with questions related to color counting and tick consistency checking.”
To be fair to the tools, the authors wrote that because the models were not trained to find problems in charts, “their performance exceeded our initial expectations.” For a staff member deciding whether a sponsor’s chart is fair, a check that flags fair charts and stays quiet about a missing title is not a design review.
What to do with the chart instead
Our reading of the two studies for an association desk is simple. Treat an AI summary of a chart as a draft of what the chart might say. When a number or a comparison is going to the board, a person reads it from the table behind the chart, not from the picture, and our number recheck walkthrough from November 3 shows how. If no table came with the chart, ask the publisher for one, or describe the chart and its source without restating its figures. When the question is whether a chart is fair, use a fixed set of design checks, such as the ones in the companion tutorial, rather than a tool’s verdict.
Exhibitor prospectuses and sponsor recap decks lean on charts of attendance by year, booth traffic and audience mix. A recap written from an AI tool’s reading of a sponsor’s chart can misstate a comparison the chart shows, and an AI check of your own prospectus chart may call it misleading when it is fair. Neither study tested event or sponsor charts, so that is our inference from their results.
One board memo, worked through
This is a teaching example, not a case study. Picture the Invented Tarnbeck Society of Lighthouse Lens Restorers, whose November memo needs to compare five years of conference attendance, and the only source in hand is a bar chart image in a partner’s report.
Suppose an AI tool’s summary comes back as a neat sentence saying attendance rose every year and peaked last year. That sentence is a comparison across five bars, the kind of reading where CharXiv found the larger gap. So the staff member asks the partner for the table, reads the five figures from it, and rewrites the sentence from the table. If the table never arrives, the memo names the chart and its source and leaves the comparison out. If someone also asks the tool whether the chart misleads and it says yes, that answer becomes a reason to look at the axis and the title, not a finding to report.
A short caution
A chart image is a picture of numbers, drawn by someone with a point to make, and the tool reading it works from the same picture. Keep the numbers tied to their table and the judgment about fairness with a person.
Sources (2)
- Zirui Wang, Mengzhou Xia, Luxi He and others (Princeton University; University of Wisconsin, Madison; The University of Hong Kong): CharXiv: Charting Gaps in Realistic Chart Understanding in Multimodal LLMs (NeurIPS 2024, Datasets and Benchmarks Track; conference paper)
- Leo Yu-Ho Lo and Huamin Qu (Hong Kong University of Science and Technology): How Good (Or Bad) Are LLMs at Detecting Misleading Visualizations? (IEEE Transactions on Visualization and Computer Graphics, vol. 31, issue 1, 2025; journal article, read as the arXiv copy)