Tutorial
BeginnerCheck an AI-Made Chart Before It Goes in the Board Packet
Log nine facts about every chart in the board packet, from where the value axis starts to what the source line says, and sort each one into STOP, VERIFY or PASS.
Time needed: About 40 minutes for seven charts and the six practice cases
Before you start:
- The charts going into the next board packet, with a note of which ones an AI tool made or redrew
- The source table behind each chart
- A browser to run the lab
AI Literacy Data Board Reporting Governance
By the end of this tutorial you will have a short log for every chart in the next board packet, nine facts per chart, and each chart sorted into STOP, VERIFY or PASS before the packet goes to the board. It works for any chart, and it matters most for the ones an AI tool drew from your spreadsheet, because those arrive looking finished.
Try it now: the AI chart check lab lists seven charts from a November board packet at an association that does not exist. Every dropdown starts empty, so fill in the nine facts yourself or load one of six practice cases, and the page sorts each chart as you change it. Nothing leaves your browser and no AI model takes part. Invented examples for practice. Not a full chart review.
Where the checks come from
The design checks come from UK government statistics guidance. We chose the lab’s rules for teaching, the two rules about checking the numbers are ours, and a PASS is not a full chart review.
Three published pages supply the design side: the UK Government Analysis Function’s guidance on Data visualisation: charts, its separate page Accessible charts: a checklist of the basics, and the UK Office for National Statistics Service Manual page on axes and gridlines. We read all three in November 2026. The charts guidance says plainly that it “is for people in government who need to design charts,” and none of the three mentions AI tools or associations, so applying them to a board packet is our reading. We use UK guidance because it states its chart rules clearly and publishes them openly.
Seven steps
-
List the charts and mark which ones an AI tool made or redrew. Give each a number and a short name, the way the lab does with Chart 1 to Chart 7.
-
Check every plotted number against the source table (our rule). This one is not in the guidance, which says nothing about checking an AI tool’s output. The UK guidance does give a related reason to publish the data behind a chart: data downloads let people “accurately recreate our charts for their own needs,” according to the charts guidance. For the method, follow the steps in Recheck Every Number in an AI Summary, which work the same way on the table behind a chart. Record All checked, Some checked or Not checked. Not checked is a STOP in the lab, and Some checked is a VERIFY.
-
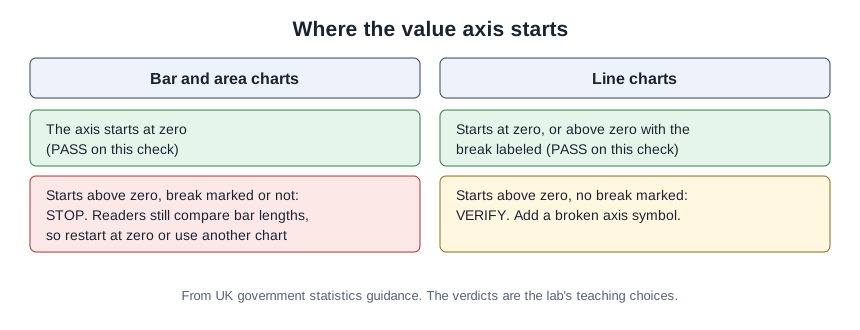
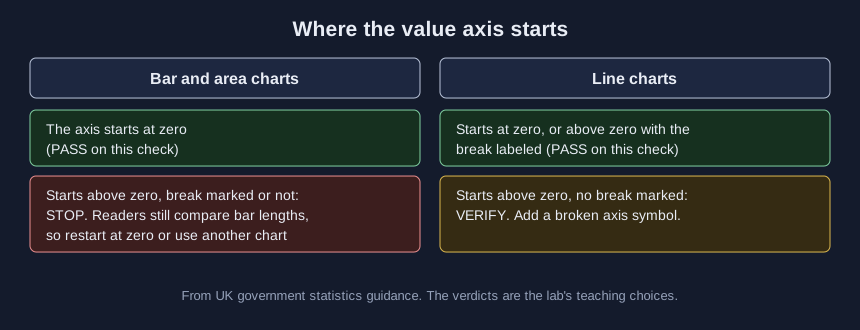
Check where the value axis starts. The ONS Service Manual says that for bars and filled areas “the axis should always start at zero. This includes bar charts and area charts,” according to its page on axes. A marked break does not rescue a bar chart: the UK checklist notes: “Even if a break in the axis is clearly signposted, the relative size of bars is still displayed very strongly on bar charts.” The charts guidance says breaking the axis “distorts these relative proportions.” Line charts are different. The same charts guidance says “it is acceptable to break a numerical y-axis on a line chart, when necessary,” as long as you “make the break in the y-axis clear and obvious using a broken axis symbol.”
-
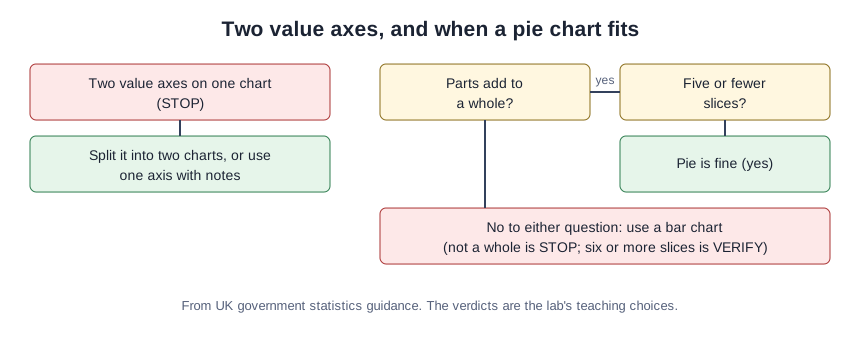
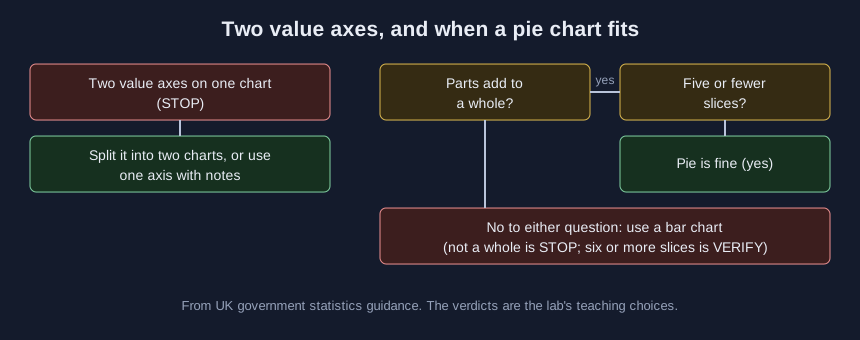
Split any chart with two value axes. The charts guidance does not recommend them because “they can be easily misinterpreted,” and adds a sharper warning: “Dual axis line charts can be manipulated to show almost any relationship.” The ONS page suggests using “either two charts or one chart with a single axis and annotations to explain the trends.”
-
Check that the chart type fits the data. Per the charts guidance, pie charts are for cases where “there are five categories or fewer” and “the categories sum to a meaningful whole.” The UK checklist warns that stacked bar charts “with more than four categories can get too cluttered,” says the same of line charts with more than four lines, and adds that negative values in stacked bars “can be difficult to understand.”
-
Check the title and the source line. The UK checklist asks for “a formal statistical title that states what the data is, the geography the data relates to and the time period shown,” and for sources in the format “[publication or source of data] from [organisation],” linked directly. The charts guidance warns against naming only an organization and linking its homepage.
-
Write the chart’s message, then enter the nine facts in the lab. The charts guidance puts it simply: “If you cannot write down the message your chart is giving in a few sentences, you should think again about the chart you have chosen.” Fix every STOP first, then clear each VERIFY.
One extra habit, not scored by the lab: when several charts show comparable data, the ONS page advises using the same axis scale for each and warns, “Different scales can be misleading.”
A worked example from the practice packet
This is a teaching example, not a case study. The Invented Tarnbeck Society of Lighthouse Lens Restorers has seven charts in its November packet, and in Case C, Chart 4 shows conference attendance and room-block pickup by year on one chart with two value axes and a headline for a title.
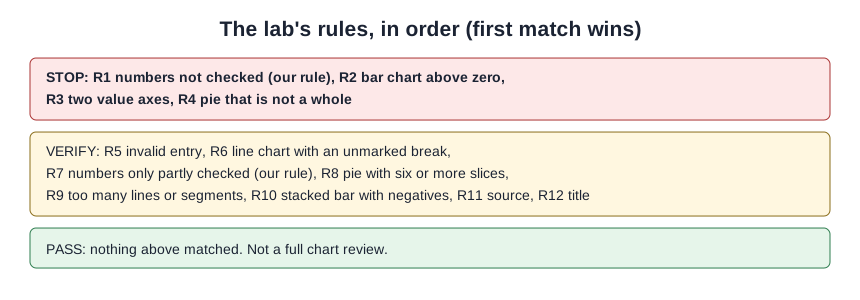
The lab gives Chart 4 a STOP under R3 for the two value axes, and it also matches R12 for the title. Fixing the title alone would leave the STOP in place. The fix is two charts, one for attendance and one for room-block pickup, each with its own axis starting at zero if they are bar charts, and each with a formal title.
Here is what a filled-in title and source line look like for Chart 2 in the same packet, written in the checklist’s format. This is an example, not real data.
- Title: Renewal rate for individual members, all regions, 2021 to 2025
- Source: 2025 membership renewal report from the Invented Tarnbeck Society membership office, linked to the report itself
The title says what the data is, where it covers and when. The source names a specific document, not just the organization.
Check your calls against the six cases
Sort each case on paper first, then load it in the lab and compare.
| Case | STOP | VERIFY | PASS |
|---|---|---|---|
| A, everything checked | 0 | 0 | 7 |
| B | 1 | 2 | 4 |
| C | 1 | 2 | 4 |
| D | 1 | 2 | 4 |
| E | 2 | 1 | 4 |
| F | 1 | 3 | 3 |
Across the six cases, seven charts match two or more rules, and the lab counts them from the rules each time. Watch Case F, Chart 1: a bar chart with a marked break is still a STOP. In Case F, Chart 3, a pie with a value axis is a combination no real pie has, so the lab asks you to fix the entry.
Mistakes that let a bad chart through
Trusting the chart because it looks finished. A clean AI-made chart can still carry a wrong number, which is why the number check comes first.
Adding a break symbol to a bar chart and calling it fixed. The bars are still read by length.
Asking the tool that drew the chart whether it is misleading. Our companion article looks at what happened when researchers tried that.
Reading a PASS as approval. A PASS means nothing you entered raised a flag. The fields cover only part of the guidance, and a chart can pass every one and still say the wrong thing.
What the lab leaves to you
The lab reads no chart and checks no number; it sorts only the facts you choose on the page. We picked its rules, the order they run in and which ones stop a chart for teaching, since the UK guidance does not rank anything, and the two number-checking rules are ours alone. Whether the chart’s message is right is still a person’s call.
Sources (3)
- Government Analysis Function (UK): Data visualisation: charts (published 19 May 2022; government guidance)
- Government Analysis Function (UK): Accessible charts: a checklist of the basics (published 2 May 2023; government guidance)
- Office for National Statistics (UK) Service Manual: Chart details: Axes and gridlines (undated page, read November 2026; government guidance)